
We’re excited to introduce the Account Rounding report — a single, streamlined revenue-focused tool designed to help managers, producers, and account managers turn coverage gaps into growth opportunities.
This report provides both leadership-level visibility across the entire agency and personalized insights for individual producers and account managers.
Before You Begin: Access & Permissions
If your organization uses Groups in the Admin Portal, you must explicitly enable the Account Rounding report for each group that should have access.
- If you use Groups: Update the group’s report access settings.
-
If you do not use Groups: No action is required — users will see the report automatically.
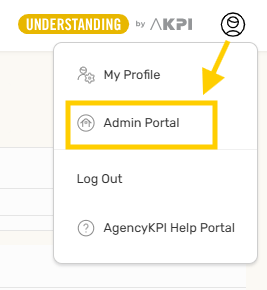
If this functionality sounds helpful, here is a link to the Admin Portal articles. You can also reach out to [email protected] for assistance.
Producer & Account Manager Mapping (New Requirement)
Because Account Rounding provides both agency-wide and user-specific views, Admins can now map AgencyKPI subscribers to the various AMS employee accounts used for producers and account managers.
Why Mapping Is Needed
AMS producer names are often inconsistent or duplicated due to:
-
Spelling variations
-
Initials vs. full names
-
Nicknames
-
Historical naming formats
Mapping resolves these inconsistencies so each producer or account manager sees only their own assigned clients.
What Mapping Does
-
Mapped users will see only their own book of business in the Account Rounding report.
-
Unmapped users will see the full report.
Important: Do Not Map Admins or Anyone Who Needs Full Visibility
Do not map:
-
Agency admins
-
Managers
-
Staff who analyze production across the entire agency
Mapping these users would restrict their visibility to a single producer’s book of business.
What You’ll Map
Match each AMS-name variation to the correct AgencyKPI subscriber.
Mapping can be updated at any time if:
-
Staff changes occur
-
AMS naming formats change
-
New users are added
-
You want to audit or refine mappings
Unlimited Users Reminder
Your subscription includes unlimited user seats, making this a great time to:
-
Add missing producers or account managers
-
Ensure your user list is complete
-
Clean up naming consistency before enabling mapping
Our team is available to help review or update your user list.
What These Reports Do
| Role | View | Core Objective |
|---|---|---|
| Managers | Full Account Rounding Dashboard | Visualize potential revenue lift across producers, carriers, and lines of business; prioritize outreach; monitor upsell activity. |
| Producers & Account Managers | Mapped Account Rounding View | Review opportunities within their assigned book, identify missing coverages, and act on suggested placements. |
Account Rounding Report Overview
Below is a walkthrough of the full Account Rounding report, including KPIs, filters, charts, and drill-down functionality.
Accessing the Report
Users will see Account Rounding in the left-side navigation.
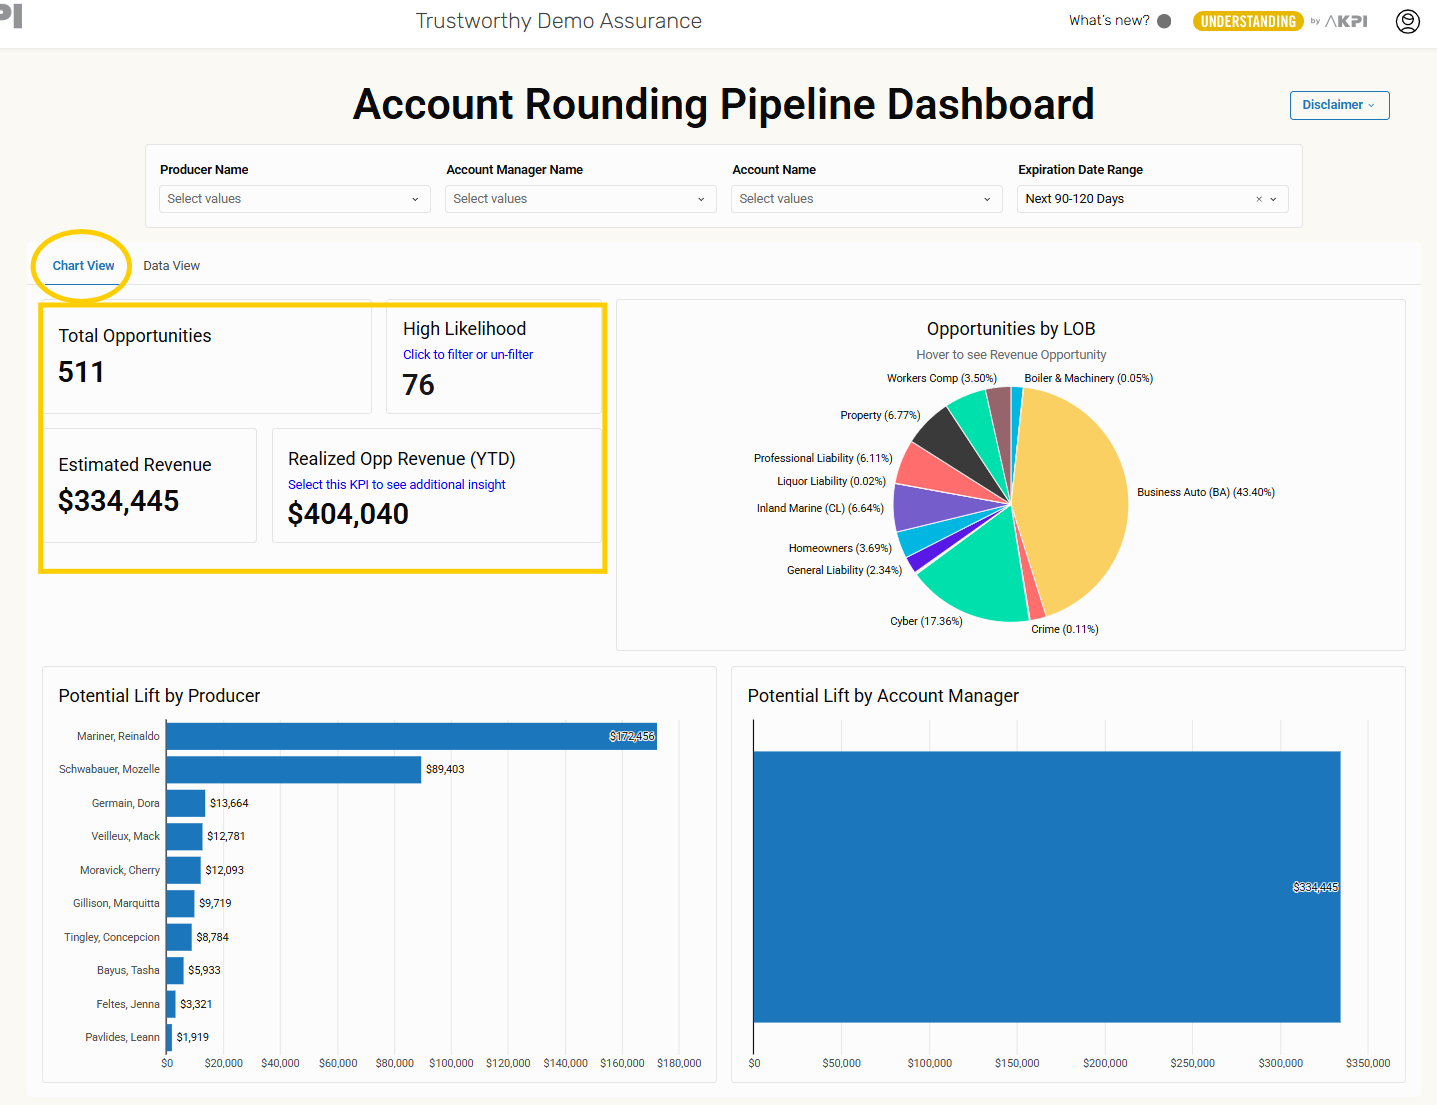
Selecting this tab opens the full dashboard, which defaults to Chart View.

Filters & Page Controls
A selection bar at the top of the page allows users to filter by:
-
Producer Name
-
Account Manager Name
-
Account Name
-
Expiration Date Range
All visuals and tables update automatically based on these selections.

Chart View Overview
Pipeline KPIs
The top of Chart View includes four core KPIs:
-
Total Opportunities
-
High Likelihood Opportunities
-
Estimated Revenue
-
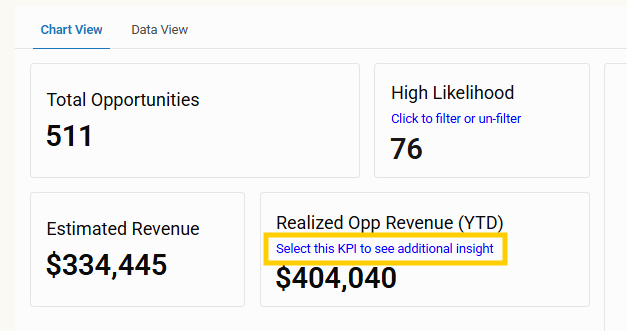
Realized Opp Revenue (YTD) — select this KPI to see additional insights
The High Likelihood KPI can be toggled on or off, filtering the entire page.
Realized Opportunity Revenue (YTD) — Detailed View
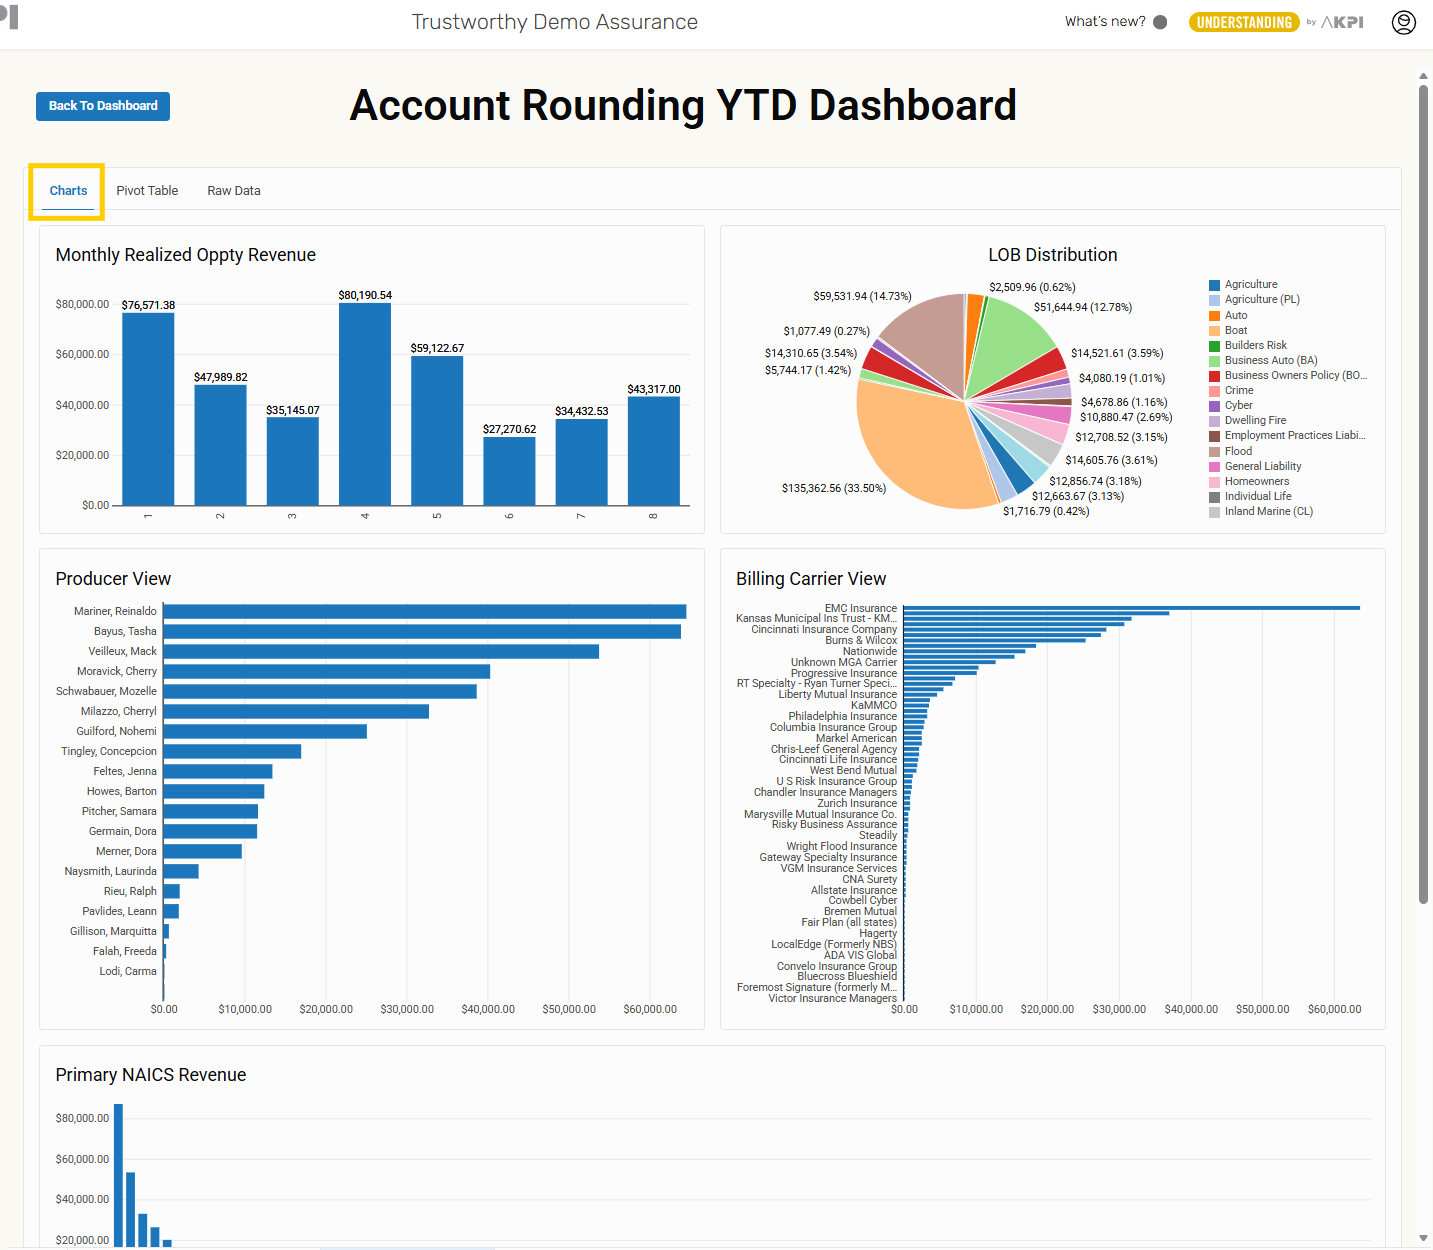
Selecting the Realized Opp Revenue (YTD) KPI opens a dedicated insights page with three tabs.
1. Charts Tab
Includes multiple visualizations of realized revenue, such as:
-
Monthly Realized Opportunity Revenue
-
Line of Business Distribution
-
Producer View
-
Billing Carrier View
-
Primary NAICS Revenue
-
State Revenue
These charts highlight trends across time, producers, carriers, industries, and states.
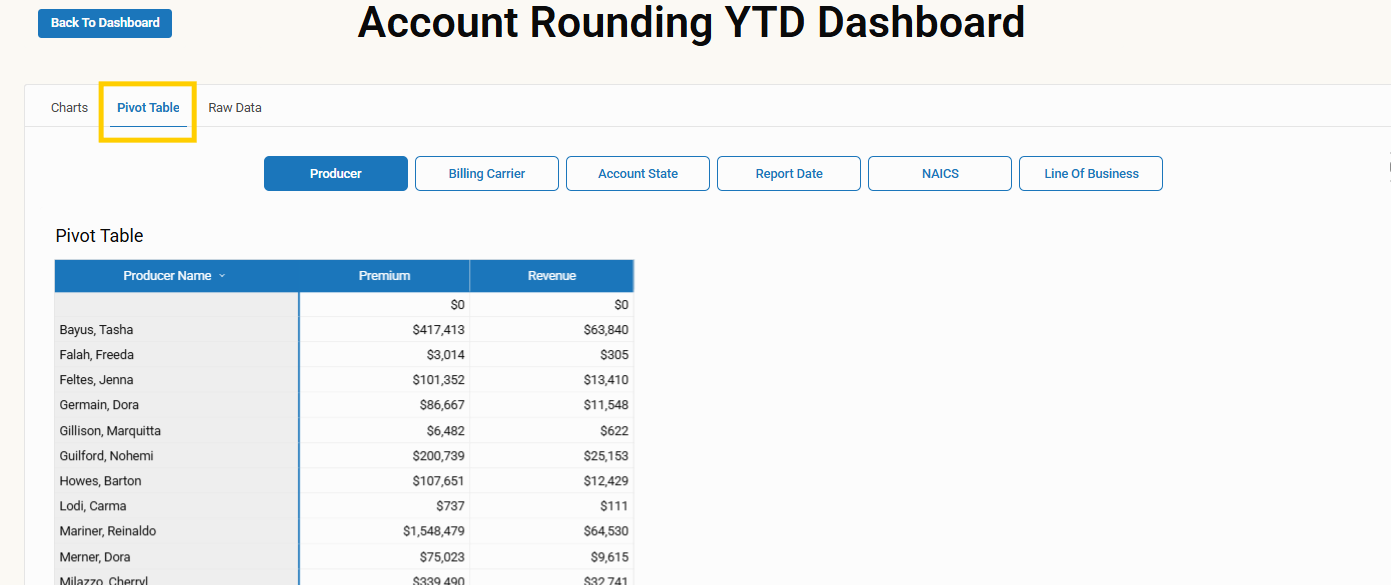
2. Pivot Table Tab
Users can explore realized revenue by pivoting across major business dimensions:
-
Producer
-
Billing Carrier
-
Account State
-
Report Date
-
NAICS
-
Line of Business
The table rebuilds instantly based on the selected dimension.
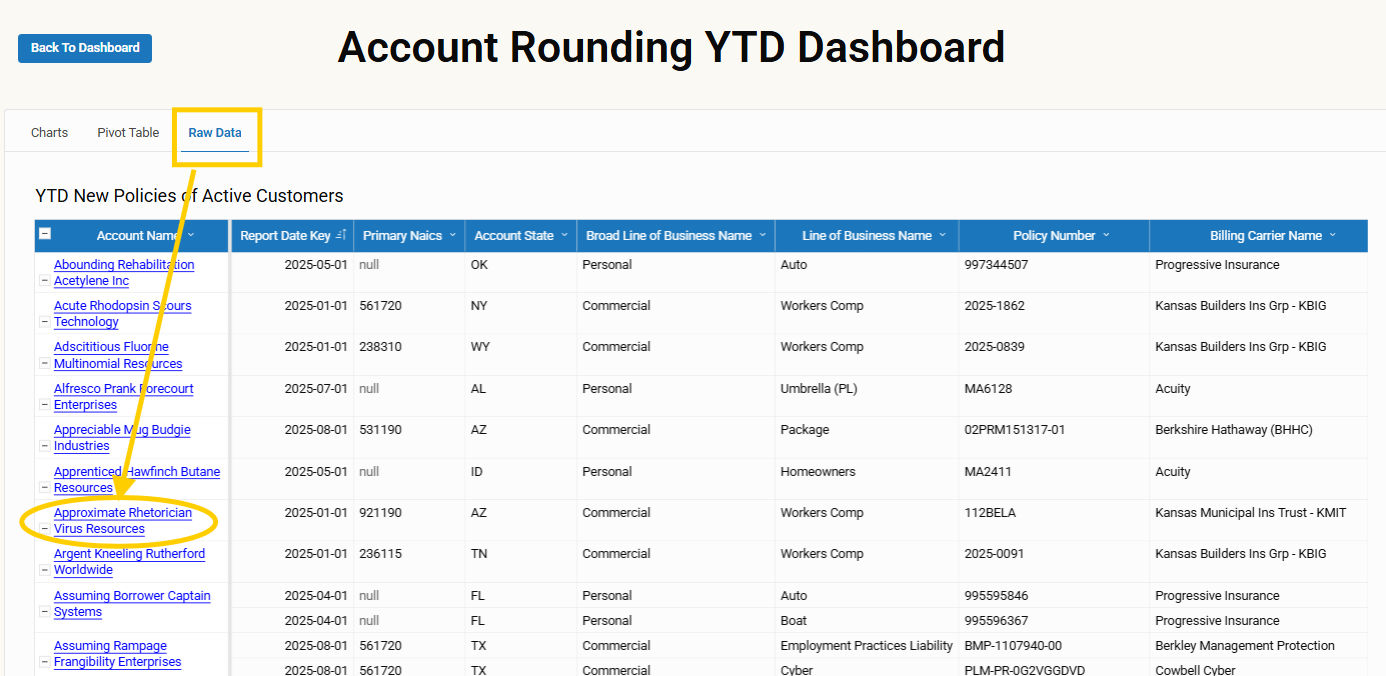
3. Raw Data Tab
Displays all underlying data powering the KPIs and charts. From this tab, users can:
-
Download the full report
-
Select any Account Name to drill into account-level details
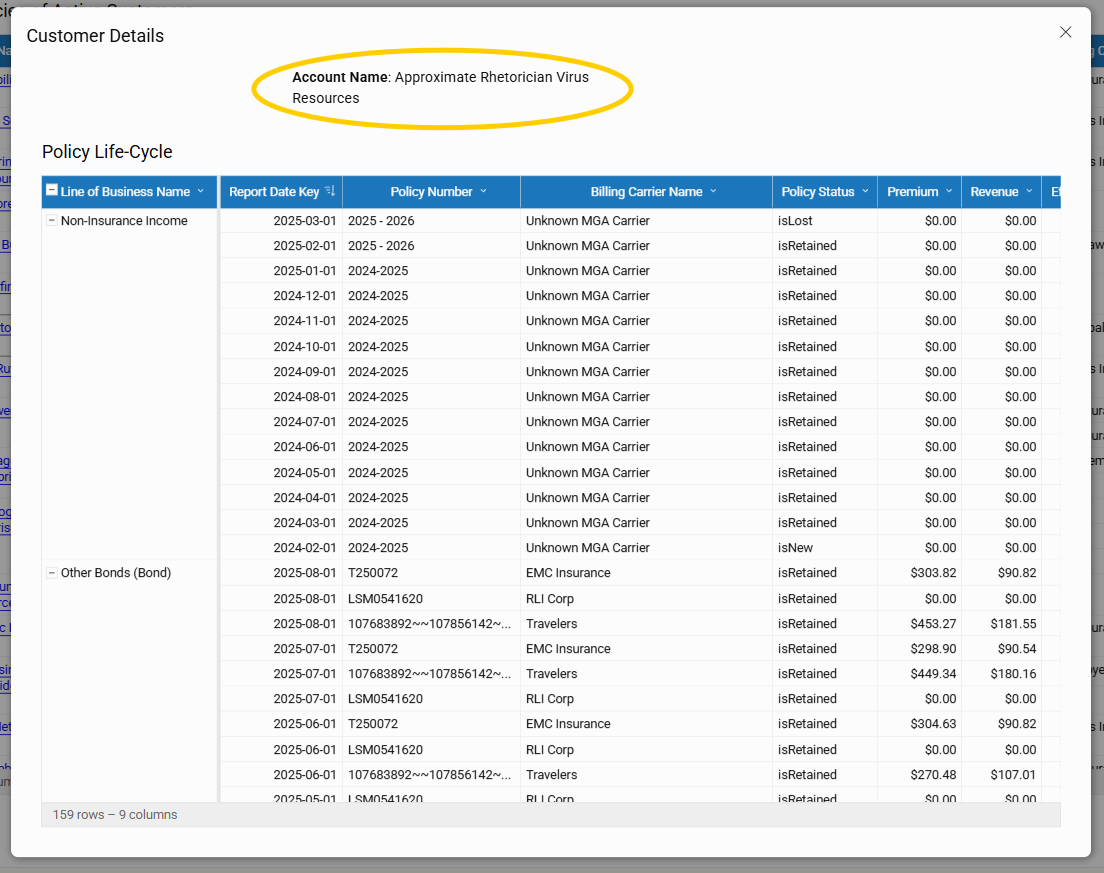
Account-Level Detail
Selecting an Account Name opens a Policy Life-Cycle card that shows:
-
Policy timeline
-
Renewal and premium history
-
Retention indicators
-
Realized revenue details
Returning to the Dashboard
Users can return to the main Pipeline Dashboard at any time by selecting Back to Dashboard in the upper left corner of the page.

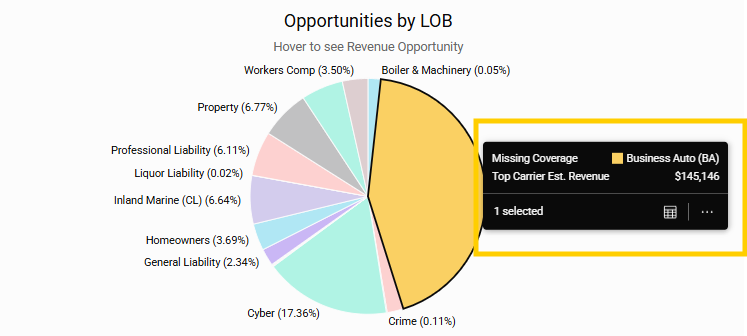
Opportunities by Line of Business (Pie Chart)
A pie chart displays opportunity distribution across Lines of Business. Users can:
-
Select slices to apply filters
-
View details such as Top Carrier Estimated Revenue
Potential Lift Charts
Two bar charts display estimated revenue potential:
-
Potential Lift by Producer
-
Potential Lift by Account Manager
Selecting any bar filters the entire dashboard to that individual.

Important Note About Estimates
A disclaimer on the dashboard states:
"This report is for informational purposes only. Recommended lines of business and estimated premiums are based on statistical models using NAICS codes, paired LOB relationships, and historical data. Estimated premiums are not quotes and may differ from actual underwriting results. Users should exercise professional judgment and verify all recommendations and pricing through appropriate quoting and underwriting processes before making any business decisions."
Data View
Selecting Data View replaces charts with the Team Opportunities table while maintaining the filter bar.
Team Opportunities Table Columns
-
Account Name
-
Next Expiration Date
-
Existing Line of Business
-
Existing LOB Premiums
-
Missing Coverage
-
Estimated Premium
-
Likelihood
-
Broad Line of Business
-
Producer
-
Account Manager Name
Note: The table is wide and may require horizontal scrolling.
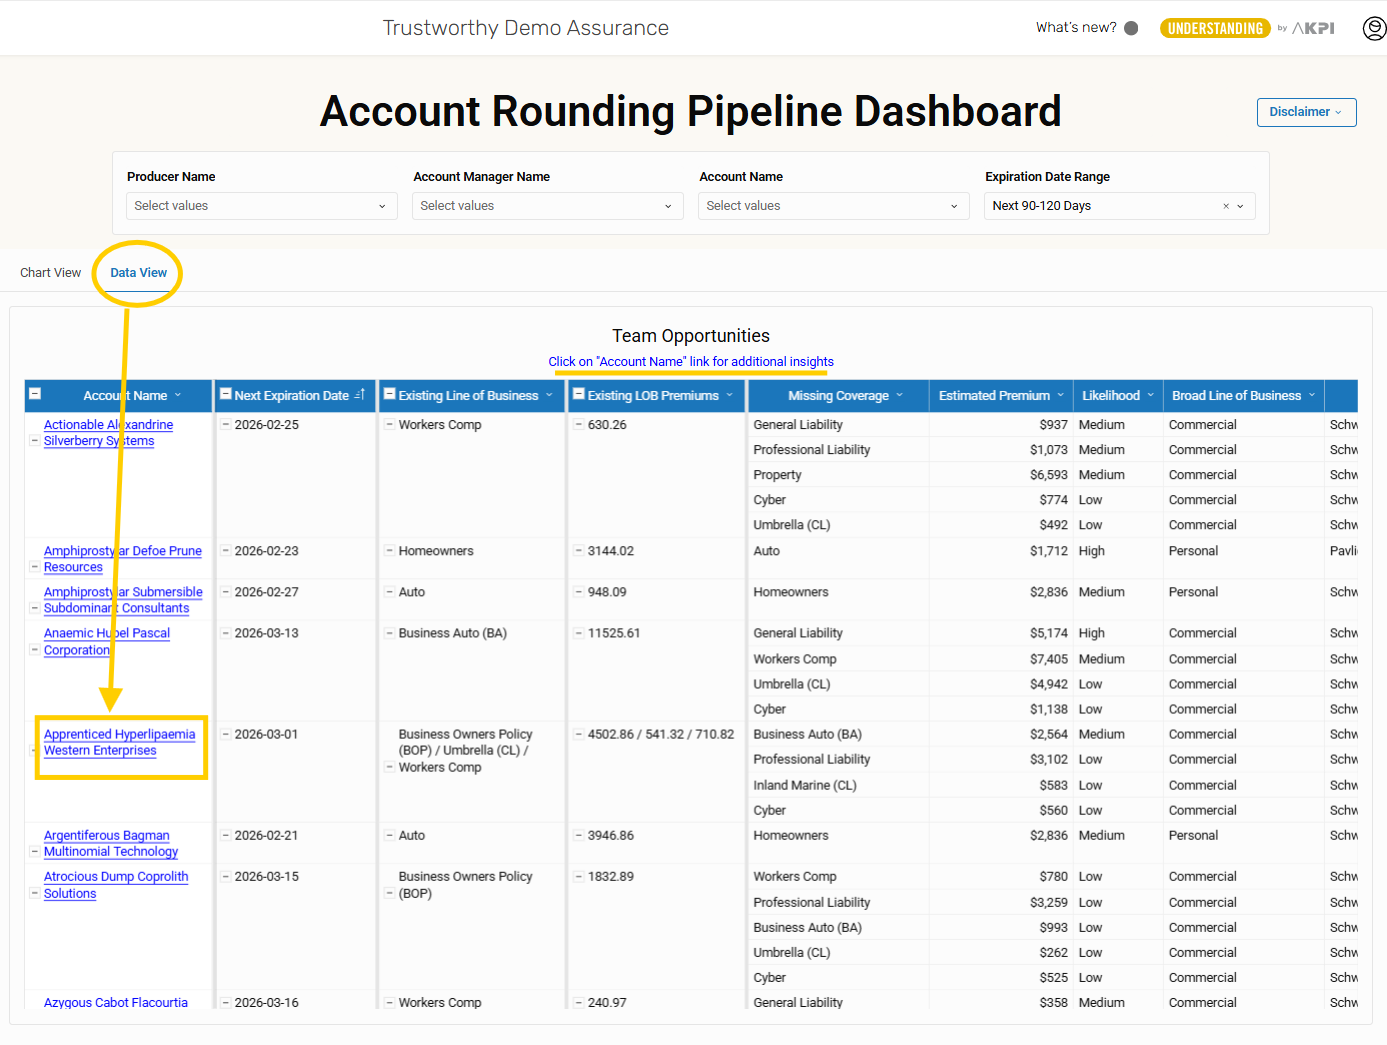
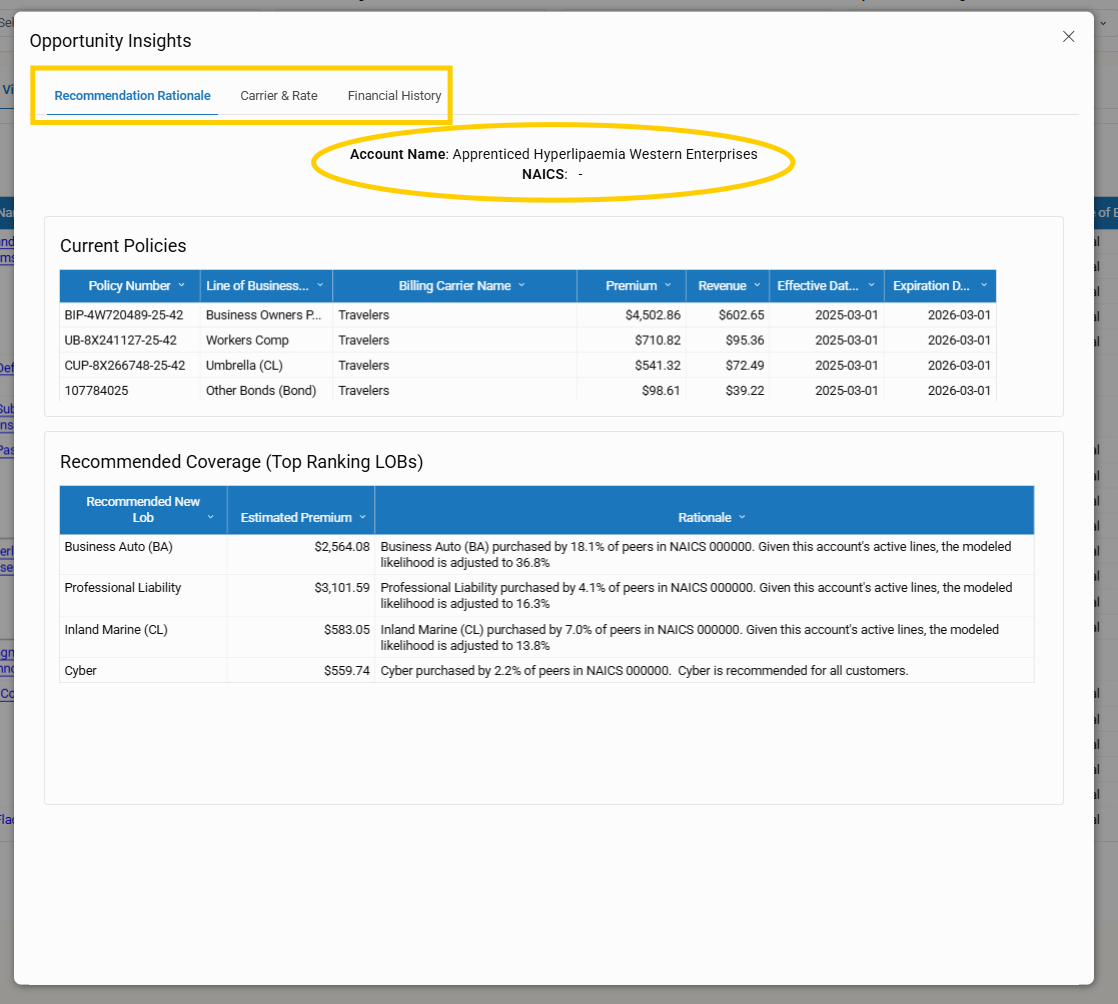
Drilling Into Account Details
Selecting an Account Name opens a detailed Client Details pop-up containing:
-
Recommendation Rationale – current policies and top recommended LOBs
-
Carrier & Rate – carrier and commission insights with adjustable Carrier Type, Market Tier, and Profit Tier
-
Financial History – policy life-cycle and retention information
Next Steps
-
Confirm Group permissions (if your agency uses Groups)
-
Review and update your user list
-
Map producers and account managers to AMS name variations
-
Contact [email protected] for assistance or questions
Your Next Growth Opportunity Is Already in Your Book
The Pipeline Dashboard and Account Rounding tools help you uncover the revenue hiding in your existing client base. With clear KPIs, intuitive filters, and data-backed recommendations, you can quickly identify upsell potential, strengthen carrier strategy, and act confidently on the opportunities that matter most.
Log in and start exploring your pipeline today.

